![]()
Lab 1 examples#
Variables#
x = 1
y = 2
z = x + y

z
3
print(z)
3
Numpy#
import numpy as np
np.arange(9).reshape((3,3))
array([[0, 1, 2],
       [3, 4, 5],
       [6, 7, 8]])
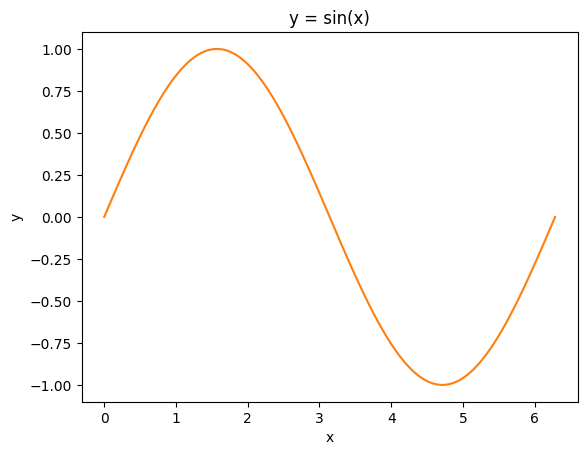
Matplotlib#
import matplotlib.pyplot as plt
fig , ax = plt.subplots()

a = np.linspace(0, 2*np.pi, 100)
b = np.sin(a)

ax.plot(a, b, color='C1')


ax.set_title('y = sin(x)')
ax.set_xlabel('x')
ax.set_ylabel('y')


fig.savefig('sine_plot.pdf')